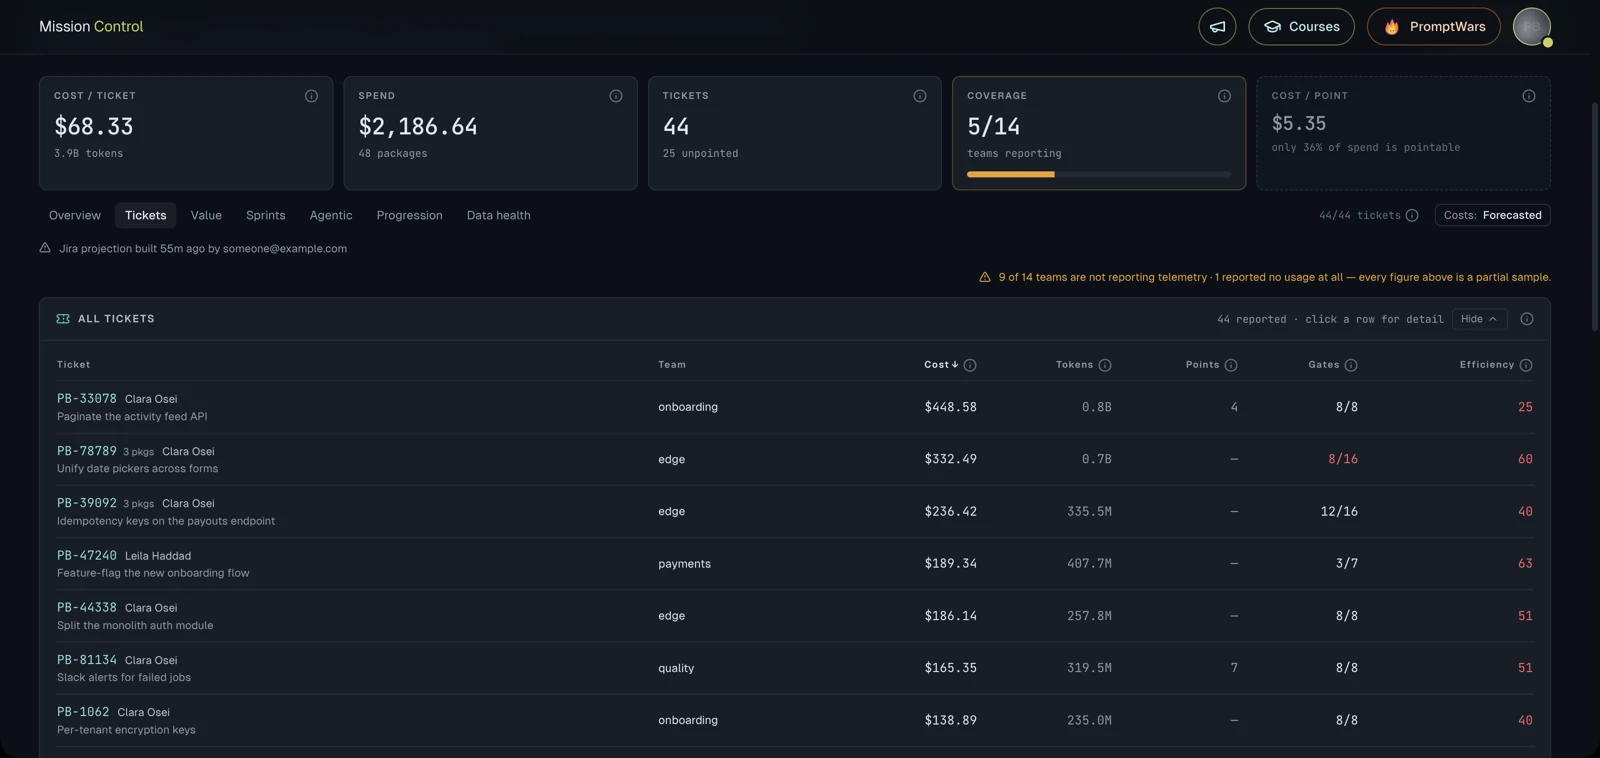
Names, tickets, teams and every figure in these screenshots are fictional; the screens and the method are real.
The problem
At work, a large engineering org with dozens of teams was adopting coding agents. Three questions kept coming up: what does this cost, is it working, and who knows how to use it well? None of them had a measured answer. Spend showed up as an invoice. Tickets lived in Jira and merge requests in GitLab. Nothing joined them, and the numbers people did quote came from whichever teams happened to report.
A figure drawn from part of the fleet is not a fleet figure. I wanted a dashboard that knew that.
What I built
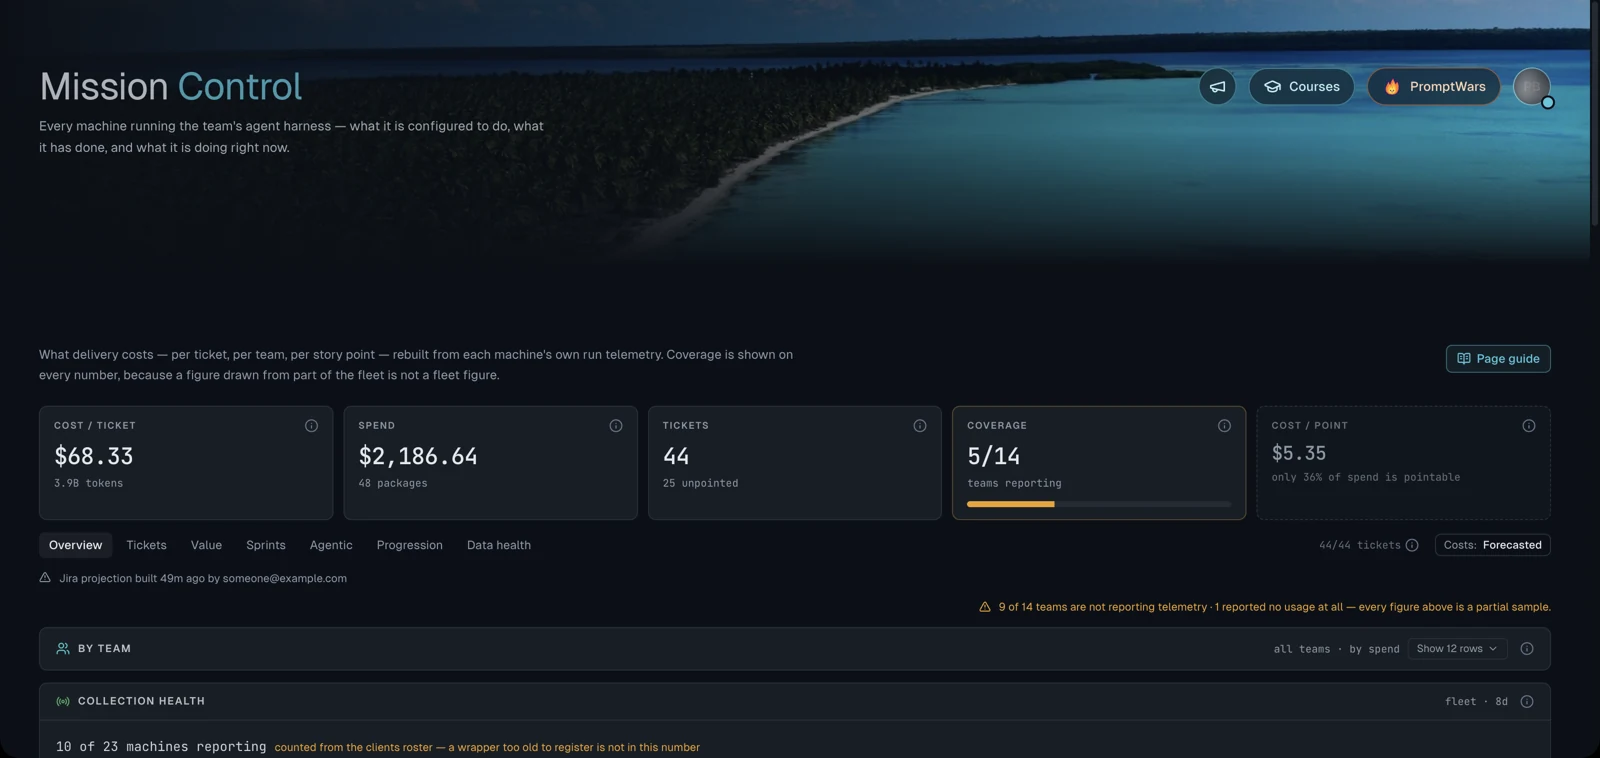
Mission Control is the control plane for the team’s agent harness. Every machine running the harness registers with a shared fleet server and forwards its run telemetry. The dashboard rebuilds what delivery costs — per ticket, per team, per story point — from that telemetry, and shows coverage on every number.
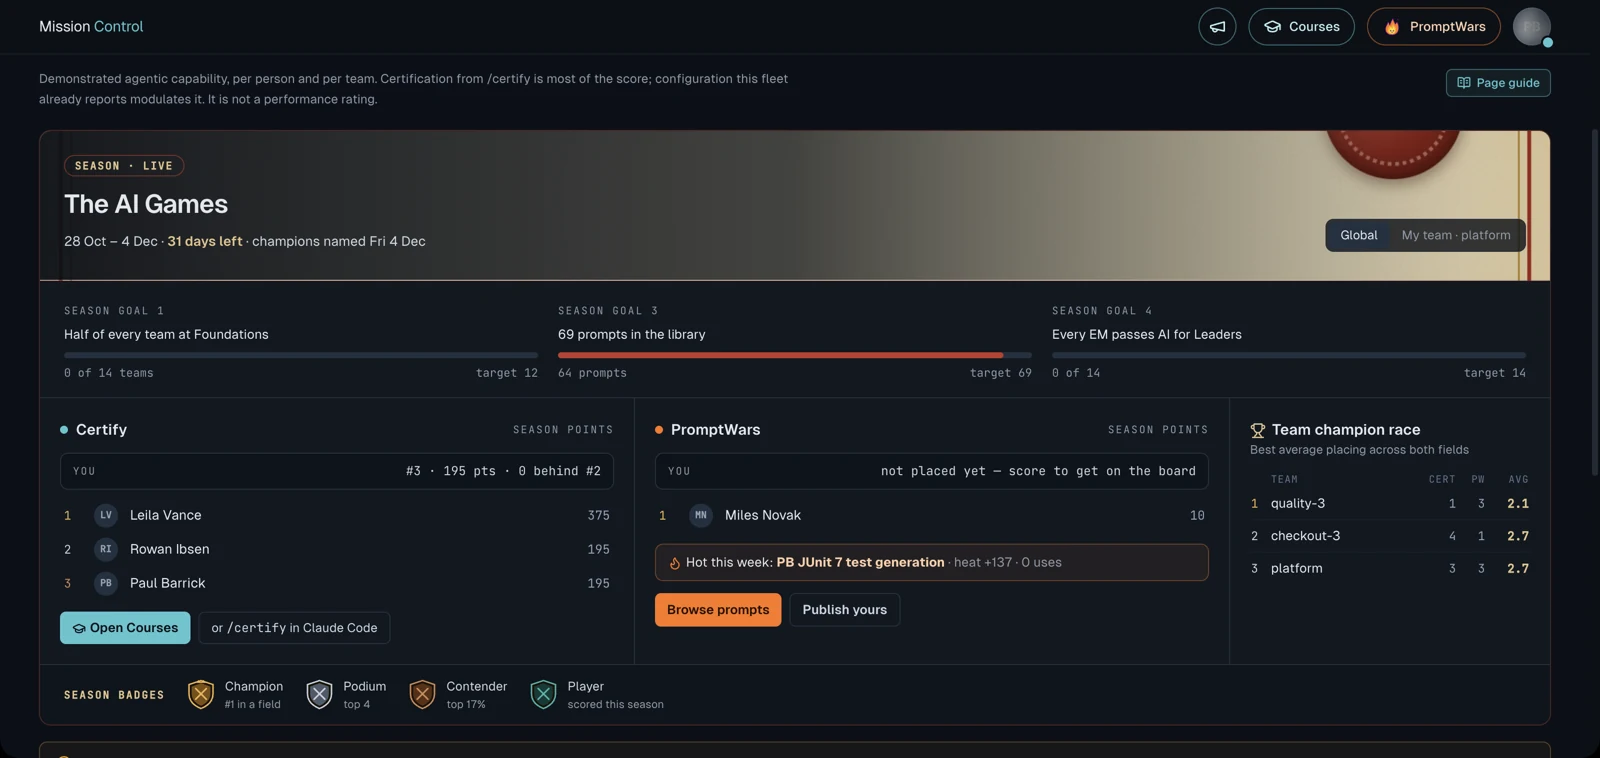
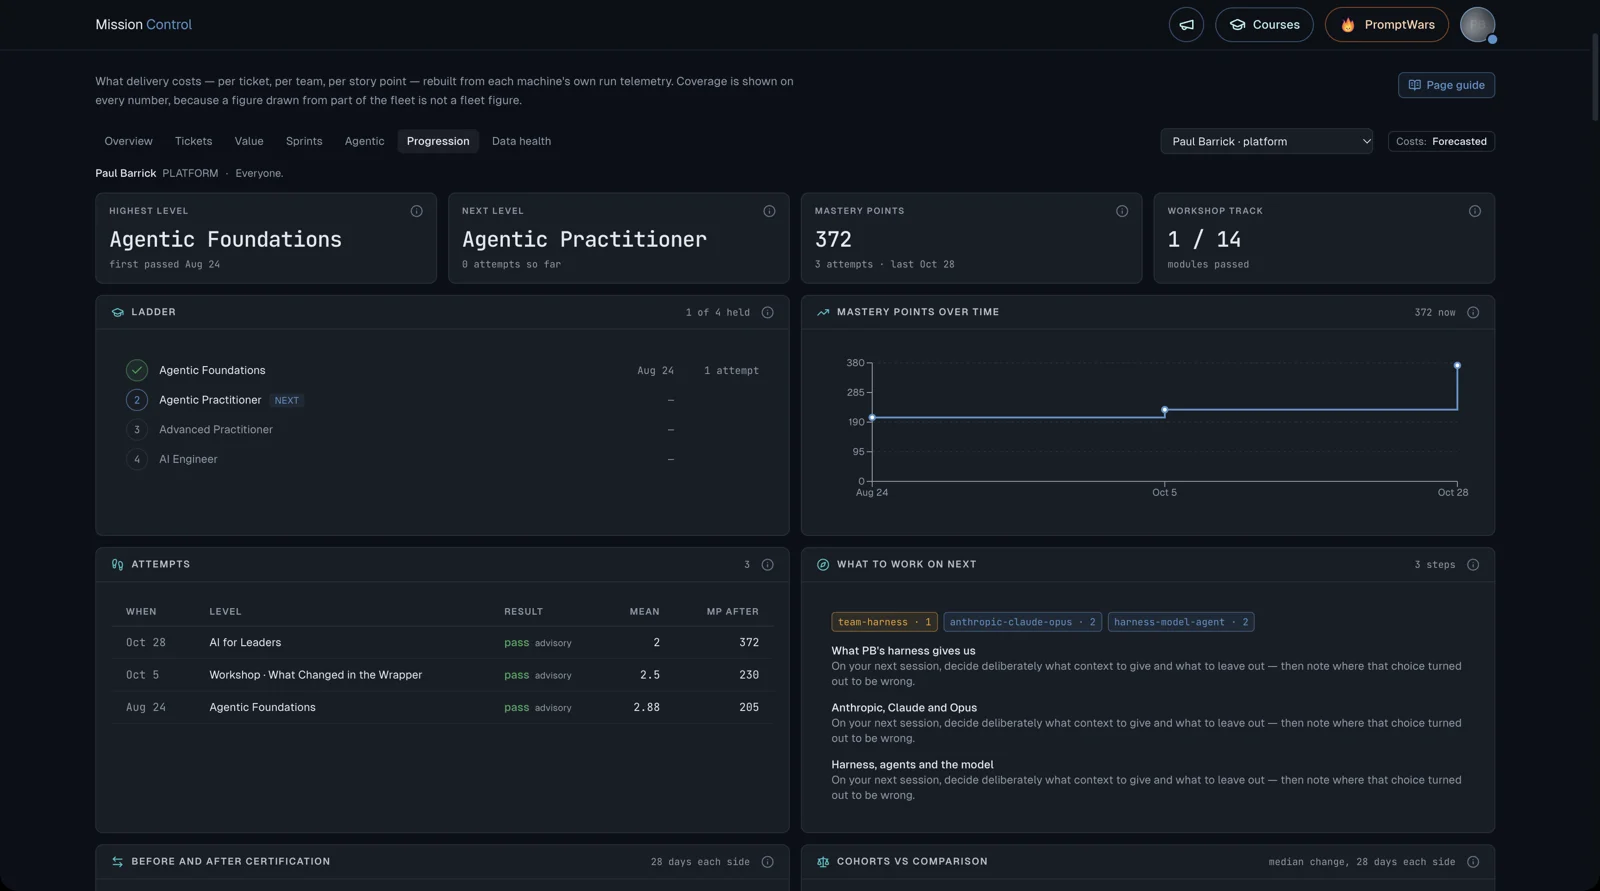
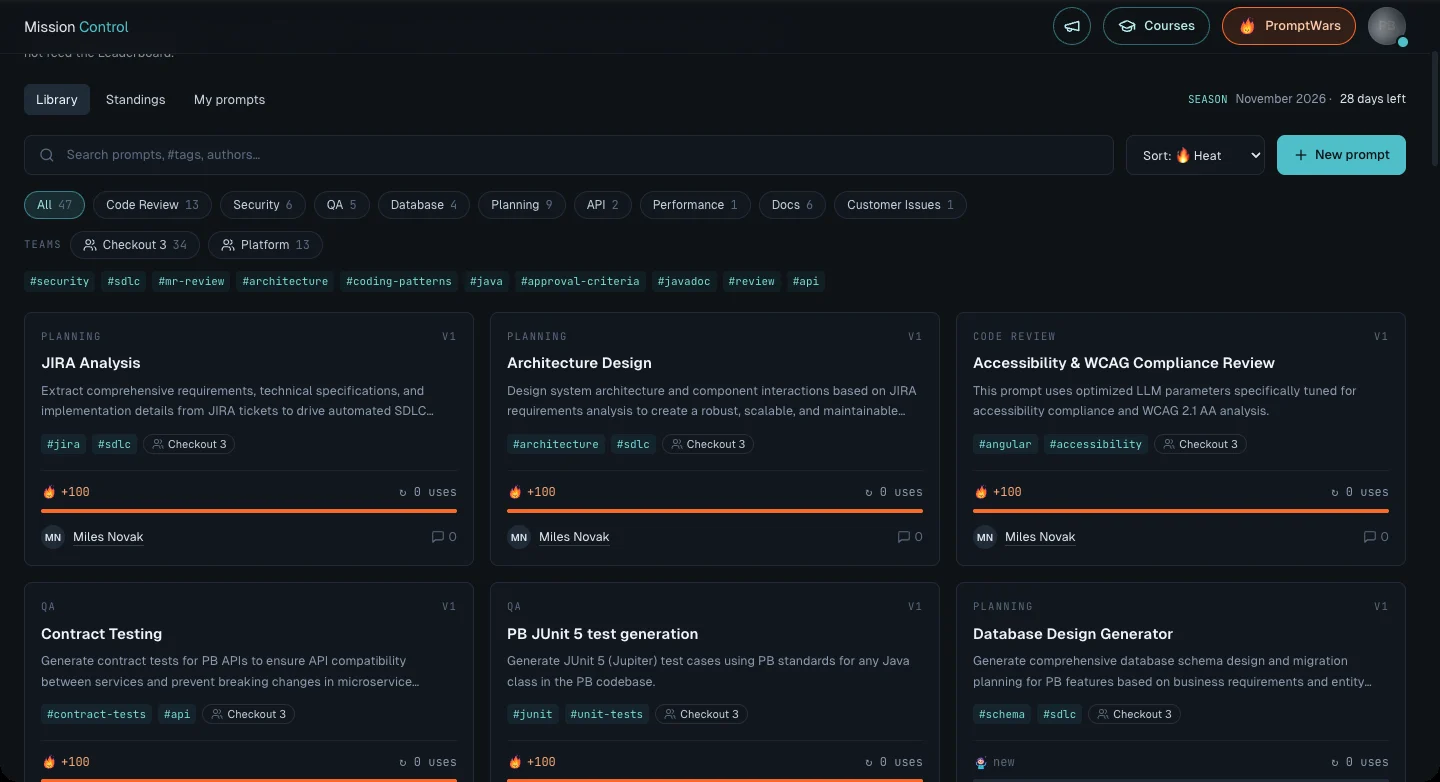
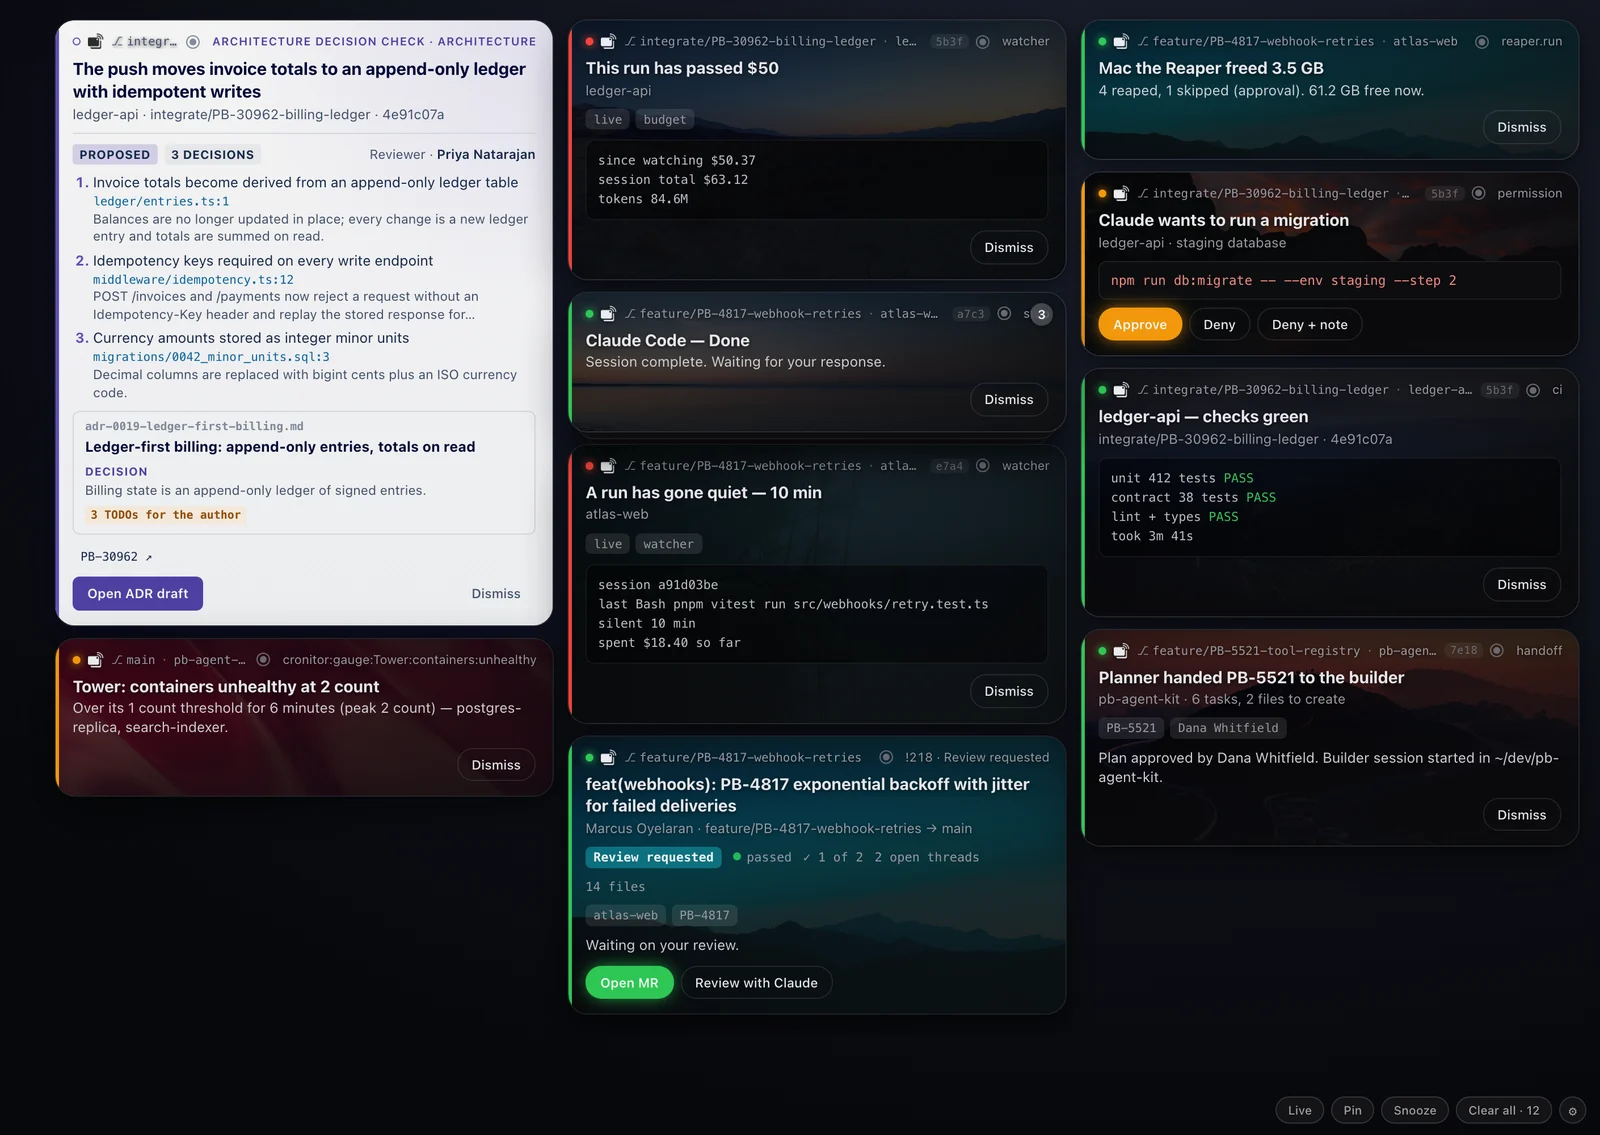
Around that core sit the parts that answer “who knows how to use it”: certification Courses, a season leaderboard called The AI Games, and PromptWars, a prompt library the team votes on. On the desktop sits Signals, a tray of live notification cards.
How it works
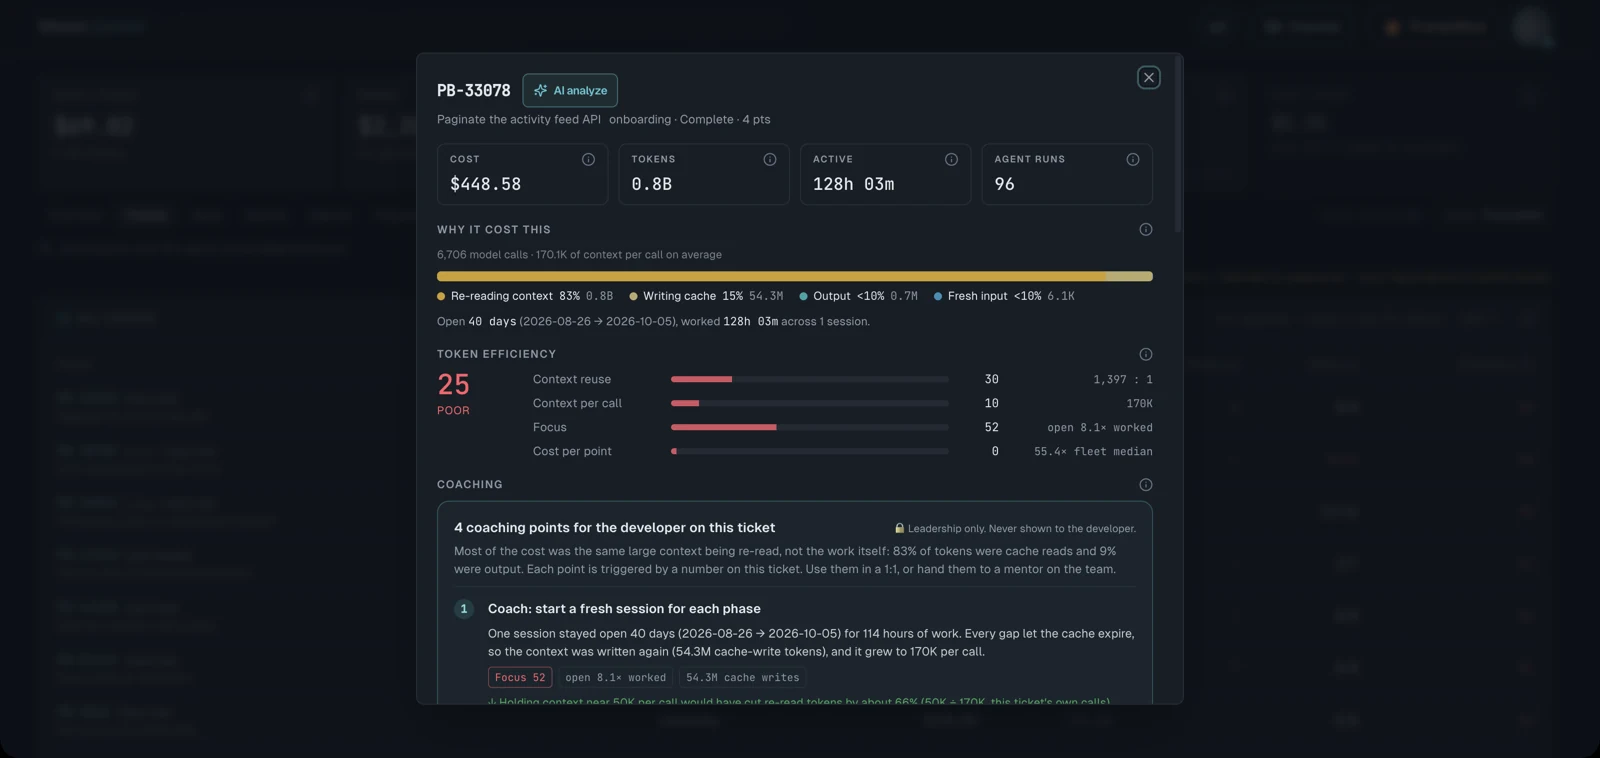
- Cost per ticket is three joins on the ticket a piece of agent work was opened against: run telemetry (cost, gates, interruptions), a projection of the ticket tracker (story points, rolled up from child stories), and merge-request flow from GitLab. Delivered points are the ticket’s own if it’s done and pointed, otherwise the done points of its children.
- Missing data is
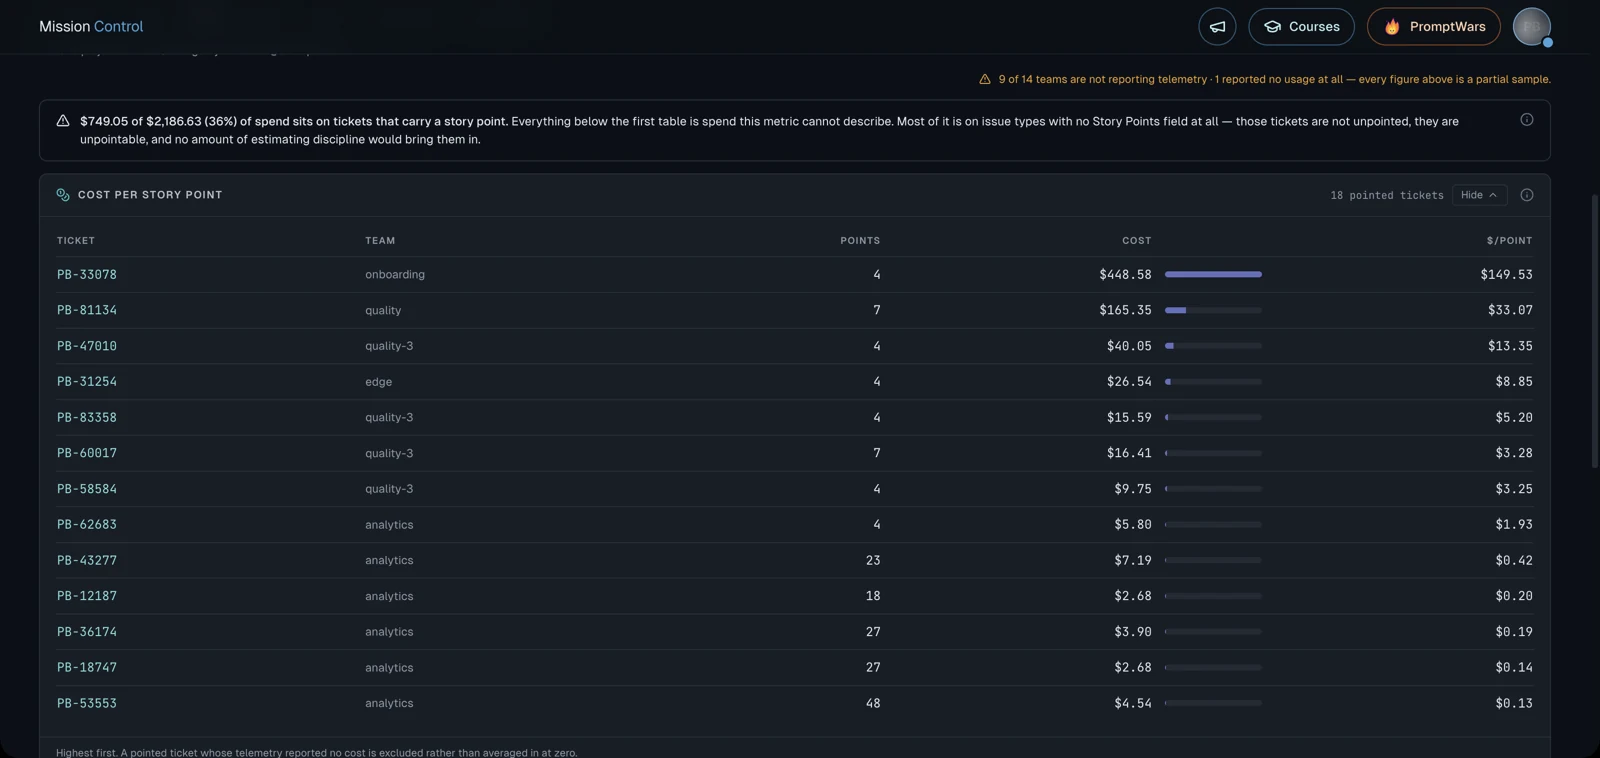
null, never zero and never infinity, and every figure carries its sample size and what it left out. The tickets screenshot is a good example: a coverage tile showing how few teams are reporting, and a warning across the page that every figure above it is a partial sample. Cost per point is shown greyed, because only a minority of that spend was on pointed work.
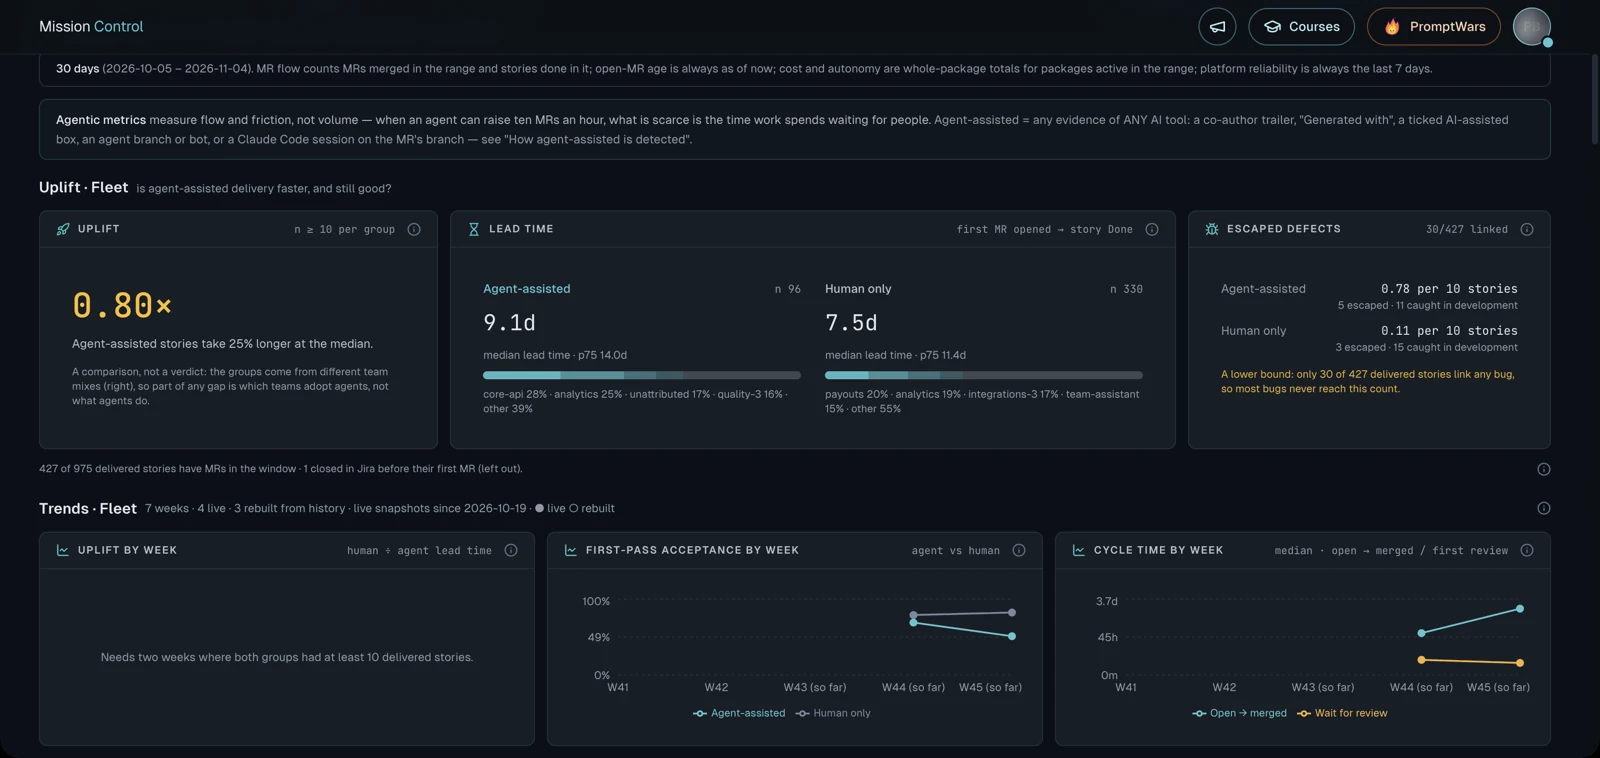
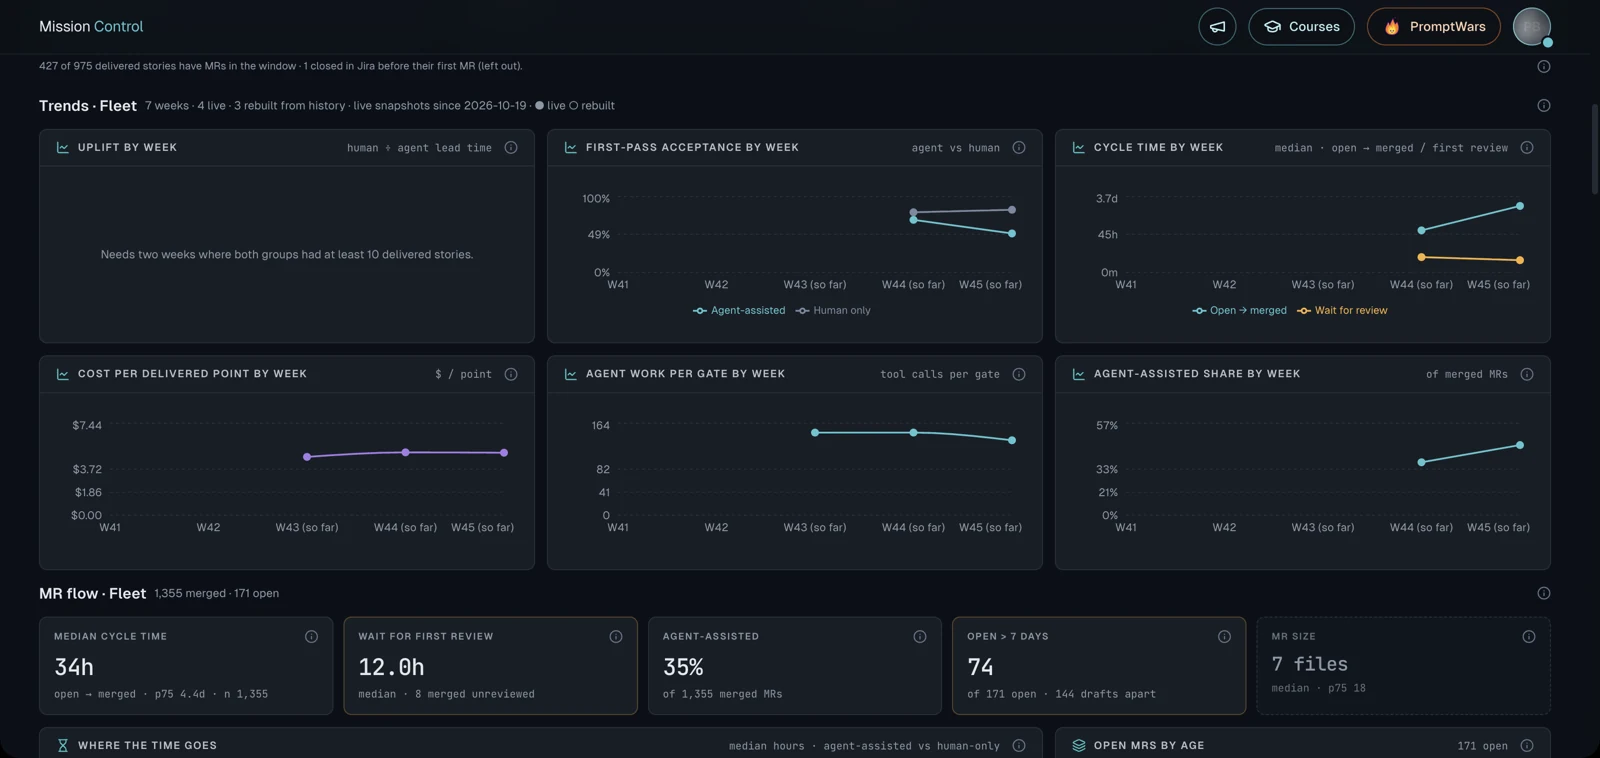
- The Agentic tab compares agent-assisted and human-only stories on lead time (first merge request opened to the story reaching Done) and escaped defects. “Agent-assisted” means any evidence of any AI tool: a co-author trailer, a ticked box, an agent branch, or a Claude Code session on the branch. The uplift ratio appears only when both groups have at least ten stories, and each group’s team mix sits beside it, because agent-assisted work is concentrated in a few teams. In the screenshot it’s below 1× — agent-assisted work running slower at the median. The dashboard shows it anyway.
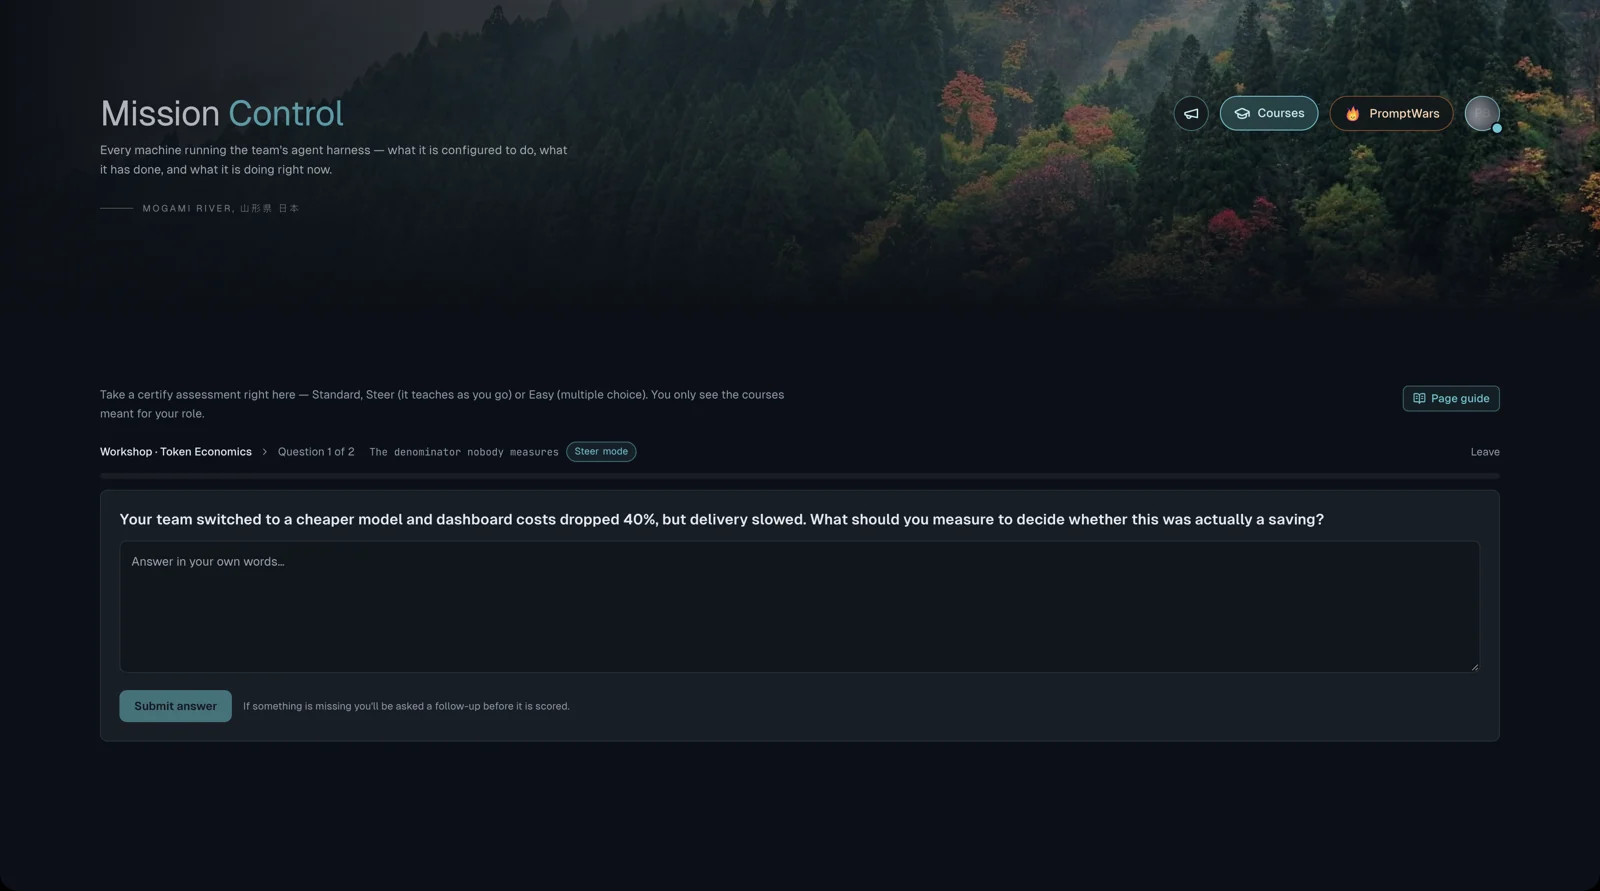
- Courses run the same assessment as the
/certifyskill in Claude Code, in three modes: Standard, Steer (it teaches as you go) and Easy (multiple choice). The client scores; the server re-validates the record against the rubric, chains it to the person’s previous record, counter-signs it, and appends. The board counts only counter-signed records.
- PromptWars prompts are voted fire, meh or dumpster. A prompt posted in the dashboard is live at once; an “Add to library” merge request moves it into git.
- Signals is one always-on-top window of cards: merge requests waiting on review, a run that has passed $50, a run gone quiet for ten minutes, a permission request with Approve and Deny. Live cards update in place.
Decisions worth noting
Advisory until calibrated, and the server decides. A certification result is advisory until two independent reviewers agree with the engine within ±1 on every competency. That used to be a flag the client sent — the wrong party to ask. Now the server computes it, and an unreadable calibration counts as uncalibrated. The cost of a wrong caveat is a caveat; the cost of a wrong “final” is a certification nobody can stand behind. No level is calibrated yet, so every result says so.
Changing a question bank is a new version. Adding a marker to a question moves the denominator — an answer that met one of one now meets one of three — so improving a live bank would silently re-score past answers. Improvements ship as a new version and the old one is frozen.
Two credentials, not one. One token forwards a machine’s events; a separate admin token publishes to every screen. With one key, any laptop, or any config pasted into a ticket, could put a card on every screen in the fleet.
Off means nothing starts. Notifications ship off. With them off, nothing is written, no watcher starts, and no tray icon appears. The permission card falls back to the normal terminal prompt, because turning off notifications must never take away your ability to answer a permission request.
Where it fits
Mission Control is work, and it stays separate from my personal Agentic OS: no shared code and no shared data. What the two have in common is how I build — coverage beside every number, a person approves, and notifications that never take away your ability to answer. The harness knows nothing about my personal tools; that boundary is a rule.
Outcome
The org now has a cost-per-ticket figure that says how much of the fleet it describes, and agentic metrics that show their sample sizes instead of hiding them. The season goals on The AI Games board turn adoption into things a team can see: half of every team at Foundations, a prompt library with a target size, and every engineering manager through the AI for Leaders course. The AI Games is explicit that it isn’t a performance rating. It’s a way to see who can do what, and who to ask.